Case Study · 03

Aero Design System

Building Birdeye's shared component library — including a complete chart system used across every dashboard in the product

Role

Design Engineer

Year

2025

Company

Birdeye

Aero Design System overview
Context

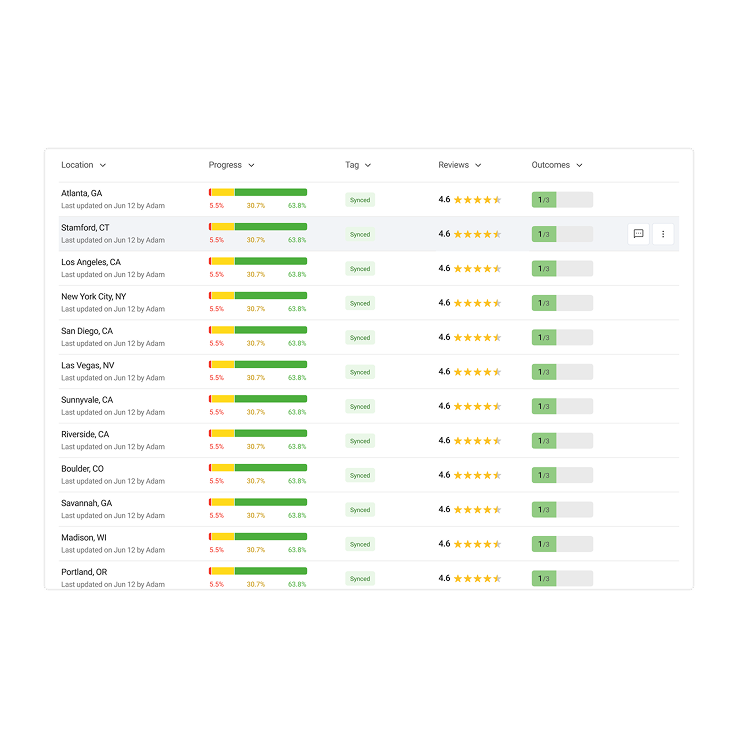
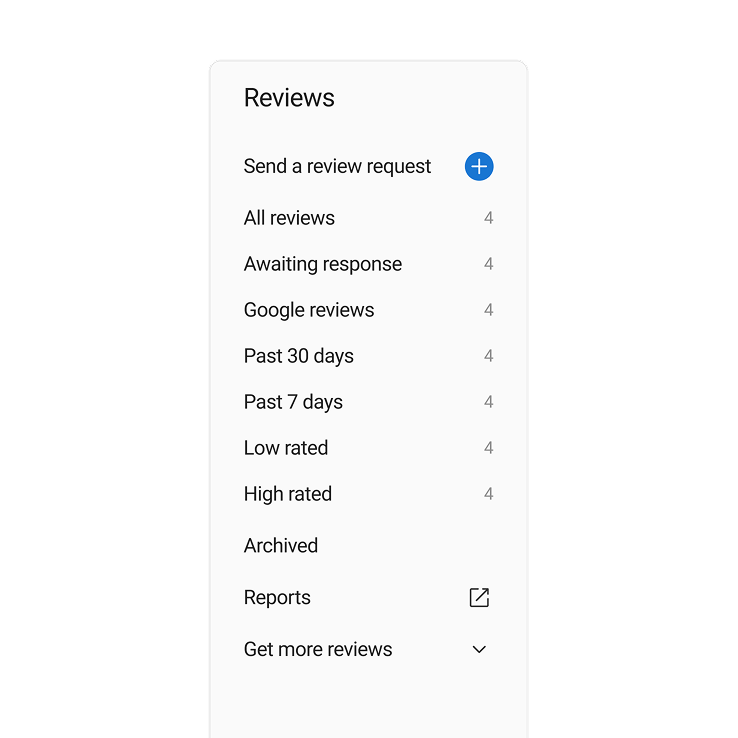
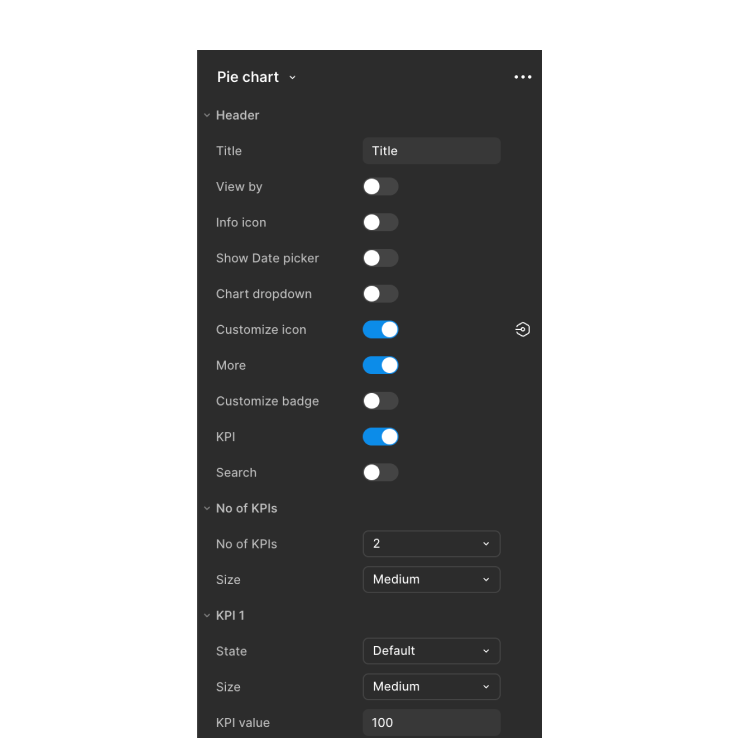
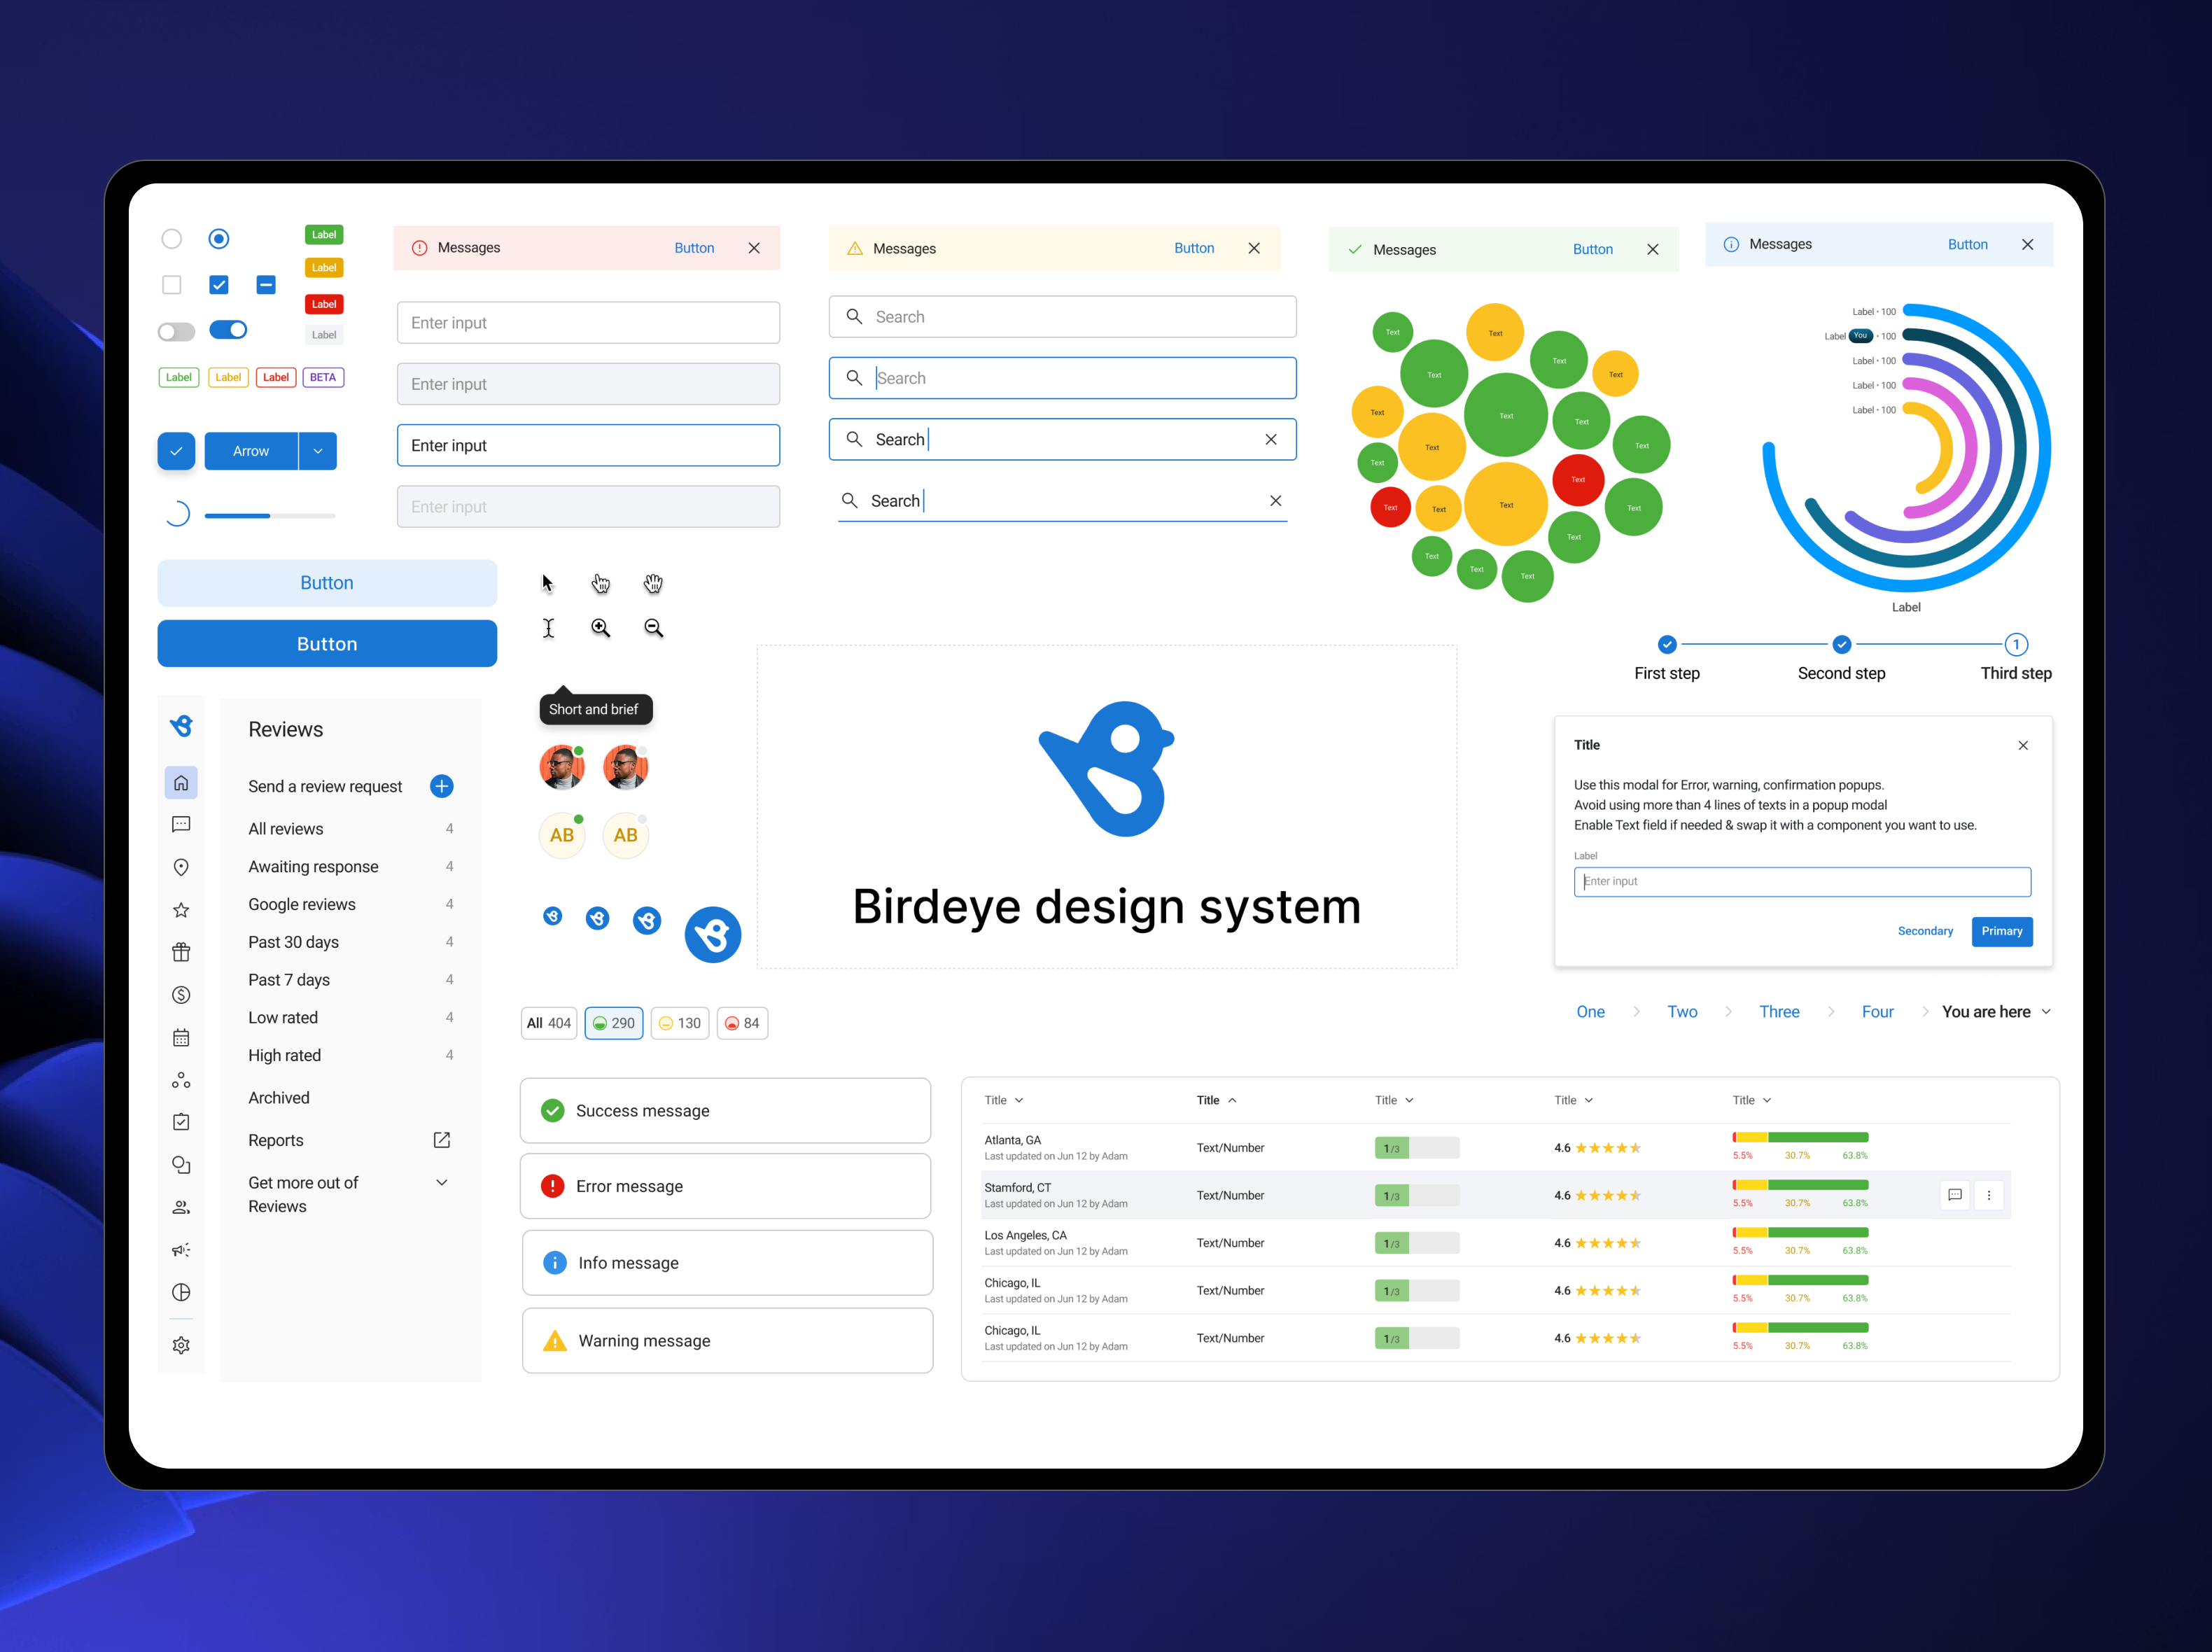
As Birdeye scaled across multiple product teams, inconsistency crept in everywhere — different button states, incompatible spacing, one-off chart implementations that couldn't be reused. Aero was the design system built to fix that: a shared foundation of 100+ components, a complete chart library of 17 visualizations, and a token system that kept everything consistent as the product evolved.

My ownership within Aero was the chart system and a range of core UI components. Every chart type used across Birdeye's dashboards and reporting tools — from simple KPI summaries to complex sunburst and heatmap visualizations — was designed, documented, and delivered as part of this work.


Scale

100+

Components in the library used across the product

17

Chart types designed and shipped for dashboards and reporting

10K

Component inserts per week, peaking at 141K during AI projects


Components & Charts

Radial Chart

Radial chart

Line Chart

Line chart

Horizontal Bar

Horizontal bar chart

Bubble Chart

Bubble chart

Sunburst Chart

Sunburst chart

Treemap

Treemap chart

Heatmap

Heatmap chart

Word Cloud

Word cloud

KPI Summary

KPI Summary

Table

Table

Navbar

Navbar

Dropdown

Dropdown

Chart System

The chart system was the most technically complex part of Aero. Data visualization at Birdeye spans reputation scores, review trends, competitor benchmarks, and campaign performance — each requiring different chart types, interaction patterns, and data states. All 17 chart types were designed to share a common visual language: consistent color tokens, unified tooltip behavior, and matching empty, loading, and error states across every variant.

Configurable by design

Every chart was built as a multi-property component in Figma — engineers and designers could configure data density, label visibility, hover states, legend position, and color themes without creating one-off variations.

17 chart typesShared token systemUnified hover statesEmpty & error statesMulti-property components
Chart system overview

Outcomes

2x

Reduction in go-to-market time for new features after system adoption

4x

Increase in design system adoption across teams post-launch

141K

Peak weekly component inserts during AI product launches

Aero shifted how Birdeye's product teams worked — from designing screens to assembling from a shared system. The chart library reduced the time to design and spec new dashboard features from days to hours. Adoption grew quickly after launch as teams saw the speed gains firsthand.


In Action